Code Data Flow

Guiding You Through the World of AI, Data Sience & Code.

Discover
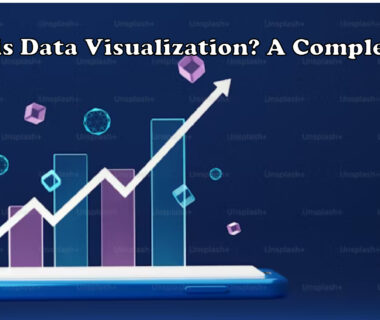
Data visualization concept showing graphs, charts, and dashboards representing data insights
Data Visualization Basic Topics

What is Data Visualization? A Complete Guide

Charts, graphs, and maps are used in data visualisation to display information in an understandable and straightforward manner. It transforms complicated data into easily understood images. Every sector has vast volumes of data, and visualization makes it easier to see patterns and trends rapidly, enabling quicker and more informed decision-making. Common Types of Data Visualization […]

Marya 
Machine Learning Lifecycle overview showing steps from problem definition, data collection, model training to deployment
Machine Learning Advanced Topics

Machine Learning Lifecycle: 7 Powerful Steps for Successful Models

The process that provides organised guidance for the creation and implementation of machine learning models is known as the machine learning lifecycle. It involves a number of steps. For the machine learning model to be successful and functional, each step is essential. We can tackle complicated issues, obtain data-driven insights, and develop scalable and sustainable […]

Marya 
AR/VR Blog
BLOG AI & Automation

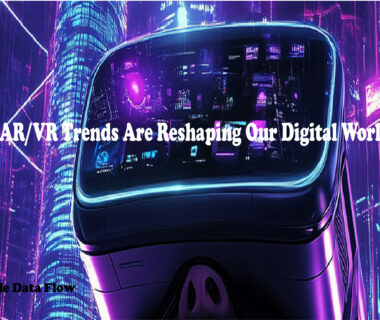
5 Ways AR/VR Trends Are Reshaping Our Digital World in 2025

Introduction Just a few years ago, augmented reality (AR) and virtual reality (VR) felt like futuristic concepts. But in 2025, immersive AR/VR experiences are no longer speculative—they are actively reshaping industries like education, healthcare, retail, and gaming. These technologies are redefining how we interact with digital content, blending the boundaries between the real and virtual […]

Marya 
AI & Machine Learning–Driven Visualization: Unlocking the Power of Data Insight
BLOG Data Visualization

AI & Machine Learning–Driven Visualization: Unlocking the Power of Data Insight

Finding meaning in large datasets has become both difficult and essential in a society that is becoming more and more data-driven. Presenting AI and machine learning-driven visualization, a potent combination of visual storytelling and sophisticated analytics that is transforming our comprehension and response to data. What Is AI-Driven Visualization? Static charts, graphs, and dashboards that […]

Marya 
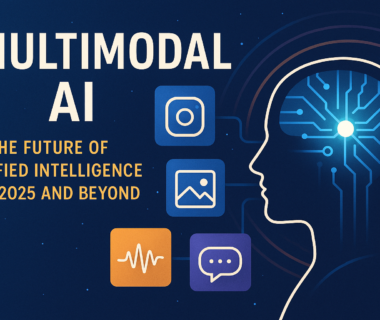
Multimodal AI integrating text, images, audio, and video for futuristic applications in 2025
BLOG AI & Automation

Multimodal AI: The Future of Unified Intelligence in 2025 and Beyond

Artificial intelligence (AI) is no longer limited to processing just text or images—it’s becoming multimodal, meaning it can now understand and generate outputs across text, image, audio, and video simultaneously. This powerful evolution is known as Multimodal AI, and it’s one of the biggest technological revolutions in 2025. The impact of unified intelligence across different […]

Marya 
Illustration explaining what is a database with comparison between relational and non-relational models
DATA SCIENCE TOUTORIALS Data Science

What is a Database? 5 Key Concepts & Comparison of Relational vs Non-Relational Models

Introduction to DataBase: In today’s data-driven world, understanding what is a database has become essential for developers, analysts, and businesses alike.Databases are at the heart of practically every program you use in this era of data-driven technology. Databases facilitate the effective storage, management, and retrieval of data in a variety of applications, including social networking […]

Marya 
Reinforcement Learning
DATA SCIENCE TOUTORIALS Machine Learning

Top 5 Reasons to Learn Reinforcement Learning: A Beginner’s Guide to Smarter AI

Introduction to Reinforcement Learning: One of the most fascinating areas of artificial intelligence is reinforcement learning, or RL. It imitates how people pick up knowledge from their experiences. In reinforcement learning, machines learn by trial and error, with the goal of maximizing rewards over time, much like a kid learns to walk by trying, failing, […]

Marya