What is Data Visualization? A Complete Guide
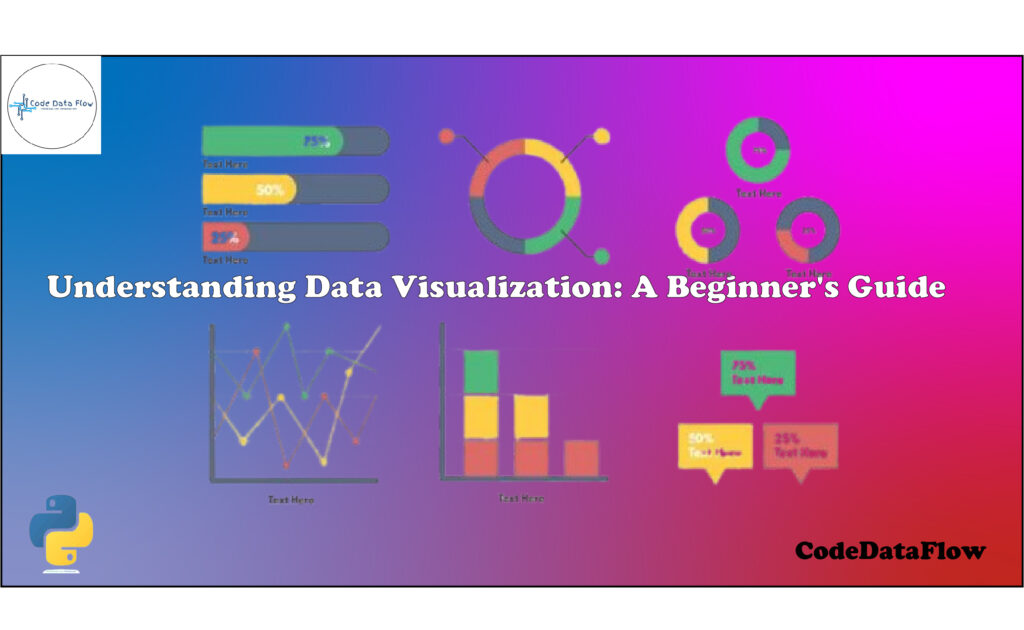
Charts, graphs, and maps are used in data visualisation to display information in an understandable and straightforward manner. It transforms […]
Dive into the world of data visualization with our comprehensive tutorials, real-world projects, and expert tips. Whether you’re a beginner or an advanced user, learn how to transform data into compelling visual stories using charts, graphs, dashboards, and more.
Charts, graphs, and maps are used in data visualisation to display information in an understandable and straightforward manner. It transforms […]
What is Data Visualization? Data visualization is one of the most effective methods for insight and storytelling in the rapidly