Latest Article
Introduction Data cleaning in machine learning pipeline is a crucial preprocessing step that involves identifying and removing missing, duplicate, or...
Agentic AI represents the next leap forward in artificial intelligence, moving beyond simple prompt-response systems. Most AI tools are limited...
Charts, graphs, and maps are used in data visualisation to display information in an understandable and straightforward manner. It transforms...
The process that provides organised guidance for the creation and implementation of machine learning models is known as the machine...
Introduction: Data is the new oil in the digital age, and Big Data is the refinery. With the rapid increase...
Introduction Just a few years ago, augmented reality (AR) and virtual reality (VR) felt like futuristic concepts. But in 2025...
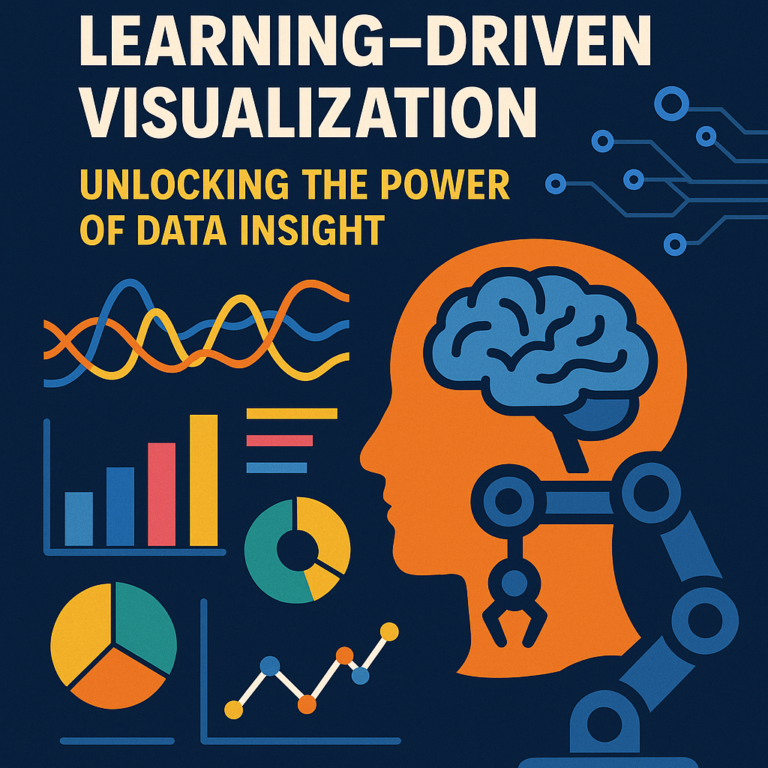
Finding meaning in large datasets has become both difficult and essential in a society that is becoming more and more...
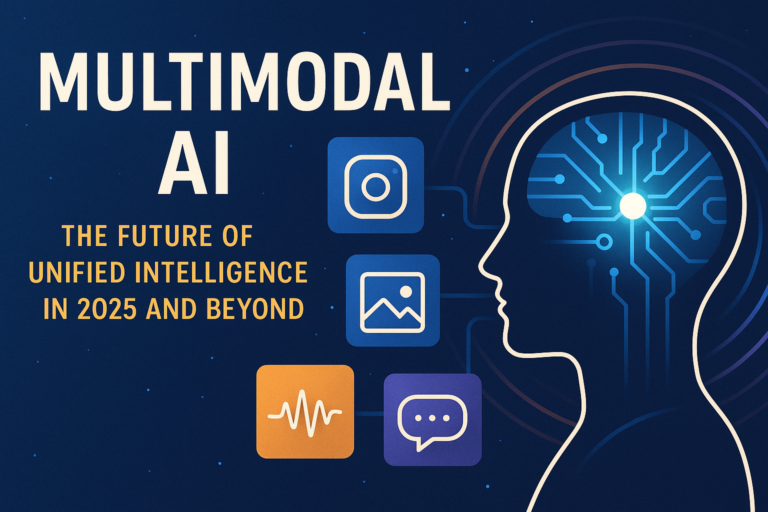
Artificial intelligence (AI) is no longer limited to processing just text or images—it’s becoming multimodal, meaning it can now understand...
Introduction to DataBase: In today’s data-driven world, understanding what is a database has become essential for developers, analysts, and businesses...
